01
details
Year
2025 - 2026
Role
Product Designer
sector
Brewery
Context
Ambev Tech is the technology hub of one of the world's largest beverage companies. SODA Vision was born from the need to meet the demands for visual inspections carried out within Ambev's factories.The SODA Vision user is the Industrial Automation Technician, a professional who works within Ambev's factories and is responsible for continuous improvements within the factory, as well as for the installation and use of the Soda Vision platform.
Before we delve into the problem, we need to understand how the physical installation of SODA Vision works. The first step is when the Industrial Automation Technician needs to choose which hardware kit is most suitable for the type of operation they will be performing the visual inspection on.
The Plus kit includes a mini PC, or gaming PC, and an industrial camera, and is suitable for high-speed operations.

The starter kit includes a Raspberry Pi 5, a webcam, and a memory card, and is suitable for low to medium speed operations.


After choosing the hardware kit, the technician then needs to perform its physical installation, which will require time and attention depending on the location in the factory where the installation will be carried out.
In the image on the side, we can see a starter kit that has been installed in a whirlpool, which is where the beer is brewed. The webcam has been positioned in the tank window, and the Raspberry Pi 5 is inside the case. The intention is to perform a visual inspection of the beer brewing phases, with photos and videos of the process, which will be sent to the SODA Vision platform and transformed into data that will be used to make improvements and maintain the quality standard.
The Challenges
Operators within industrial facilities were having difficulty performing manual visual inspections, leading to a decline in the quality of beer production and other manual tasks within the factories.
Industrial Automation Technicians were having difficulty physically installing the SODA Vision kit.
Industrial Automation Technicians were unable to obtain good images to train the SODA Vision AI.
Goals
Reduce human error when performing routine visual inspections within factories.
Increase the number of factories using SODA Vision.
Improve the quality of datasets trained within the SODA Vision platform.
My Role
Within the company, my responsibilities included creating and improving user experiences in collaboration with the team, leading the design roadmap, and producing artifacts such as user journeys, flows, and discoveries. Weekly, I conducted ideation and discovery sessions to identify opportunities and designed interfaces focusing on usability, accessibility, and aesthetics, creating low- and high-fidelity prototypes for validation with the team, as well as conducting usability research and testing to support decision-making.
Within SODA Vision, I worked in a triad: product designer, product manager, and engineer, plus a team of 6 people including developers, customer success, and automation specialists.
Research
To better understand the pain points users faced daily when installing the kit, capturing images, and using the platform, we (the product trio) decided to conduct in-depth (1:1) interviews with six users selected by the PM. Since our user (Industrial Automation Technician) is an employee of the company, I simply contacted him to schedule the conversation.
To do this, I created a research plan and script with questions that would allow me to discover what this technician's routine was like within the factory, how the purchase and installation of the physical kit went, what the experience was like capturing images for AI training, and how he used the platform.
The results of the interviews generated the following user journey map, showing the entire path the user takes to install, take photos, and use the platform, as well as the post-use phase, where and how they consumed the generated data, in addition to all the pain points, feelings, and challenges the user faces.

Problems encountered in the user journey
User finds installing some drivers difficult;
Had to learn how to use Linux;
Some installation packages were outdated;
Had difficulty using Node-Red;
Didn't know the browser needed to be open on the Raspberry PI to send images;
Problems with lighting;
Problems with the electrical system;
Difficulty adjusting the camera to the correct angle;
Problems with cable changes;
Problems with the network (wired or wireless);
Unhealthy environment (high temperatures, needs equipment protection);
Has given up on a project due to technical problems;
Had physical difficulties;
Had difficulty obtaining enough images to create the dataset;
Problems with image resolution;
Difficulty exporting images;
AI doesn't differentiate between good and bad images;
Trained models disappear on the platform;
Having difficulty filling out the template.
Prioritizing Values
Since we had mapped many problems in the user journey, we opted to use the Impact vs. Effort Matrix to help prioritize what really mattered. To do this, we brought together some more people from the team (developers and automation specialists) who didn't normally participate in business decisions, to participate more actively in the product area. Below is an image of the activity done in a group; I was responsible for leading the meeting and summarizing the information.

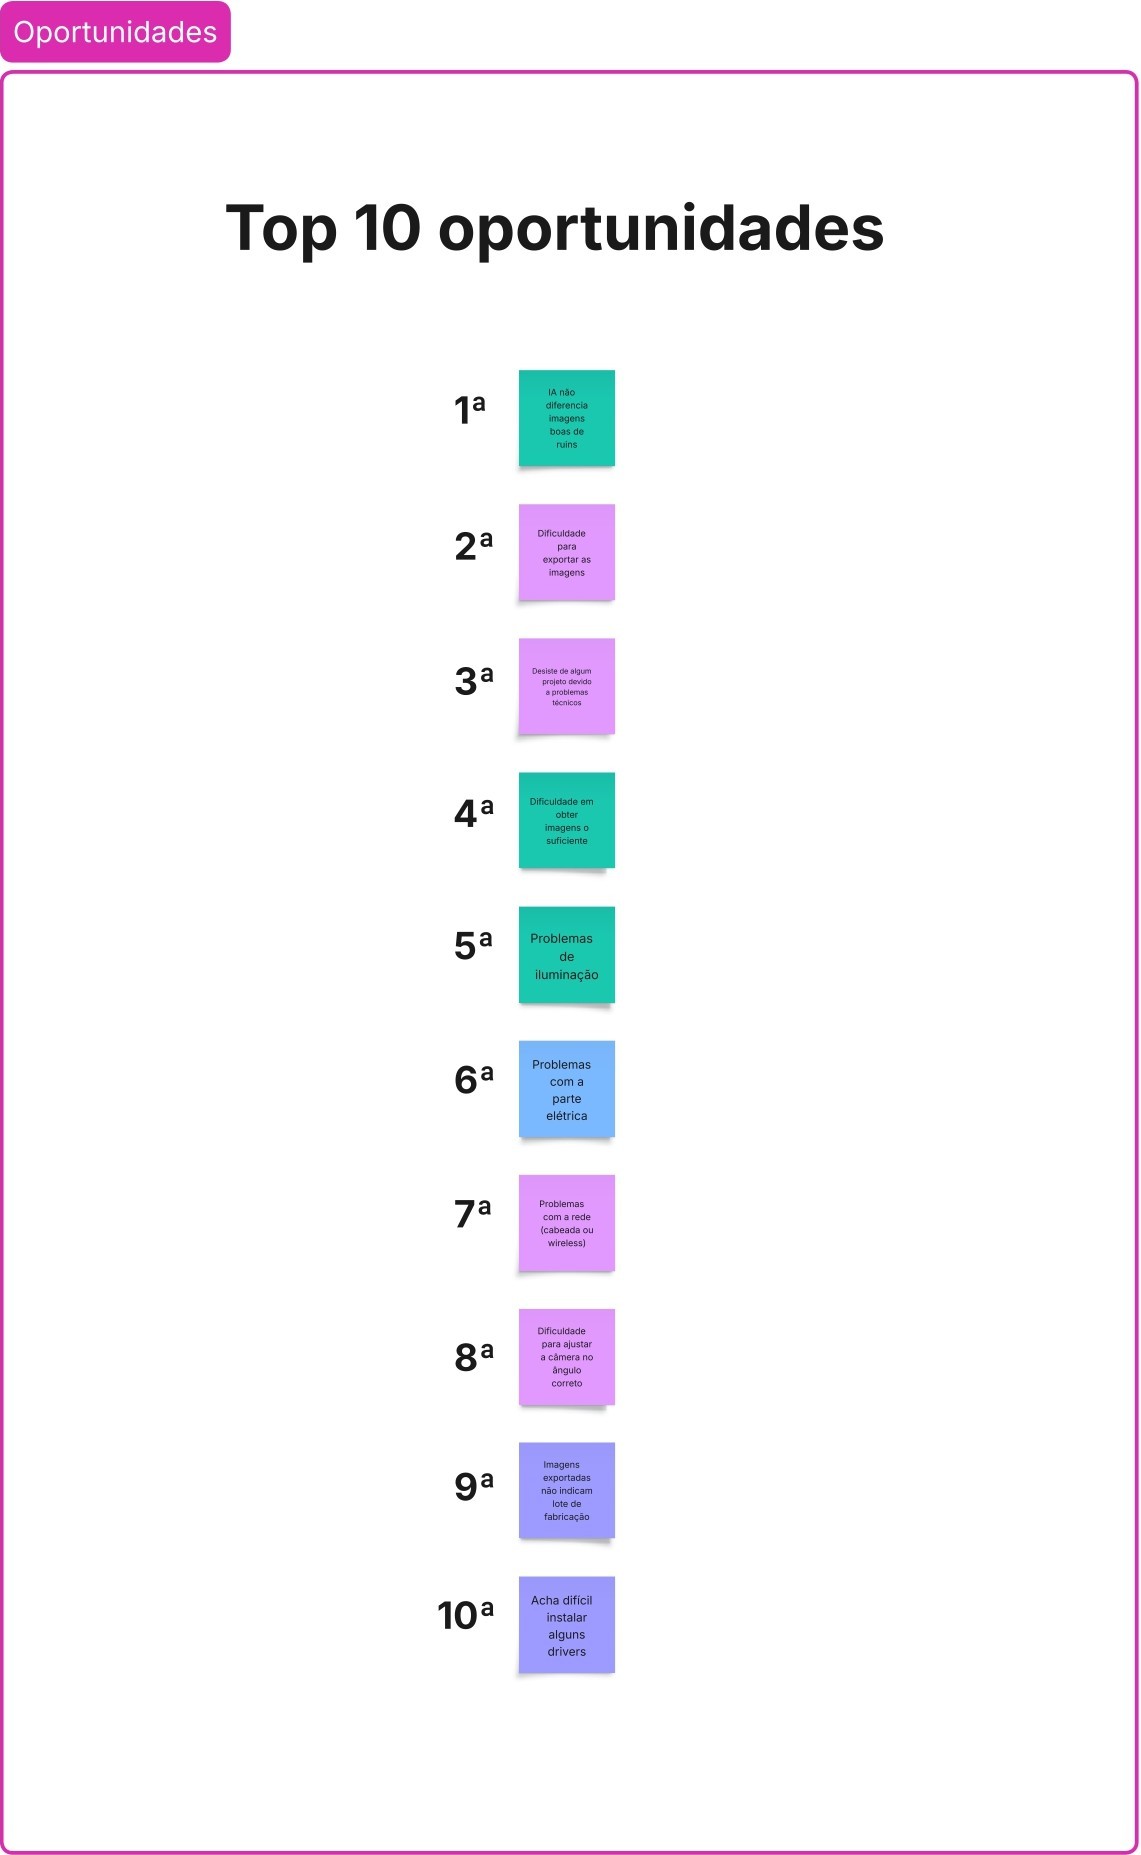
Key opportunities
After completing the group matrix activity, we selected the 10 most important opportunities to work on a solution:
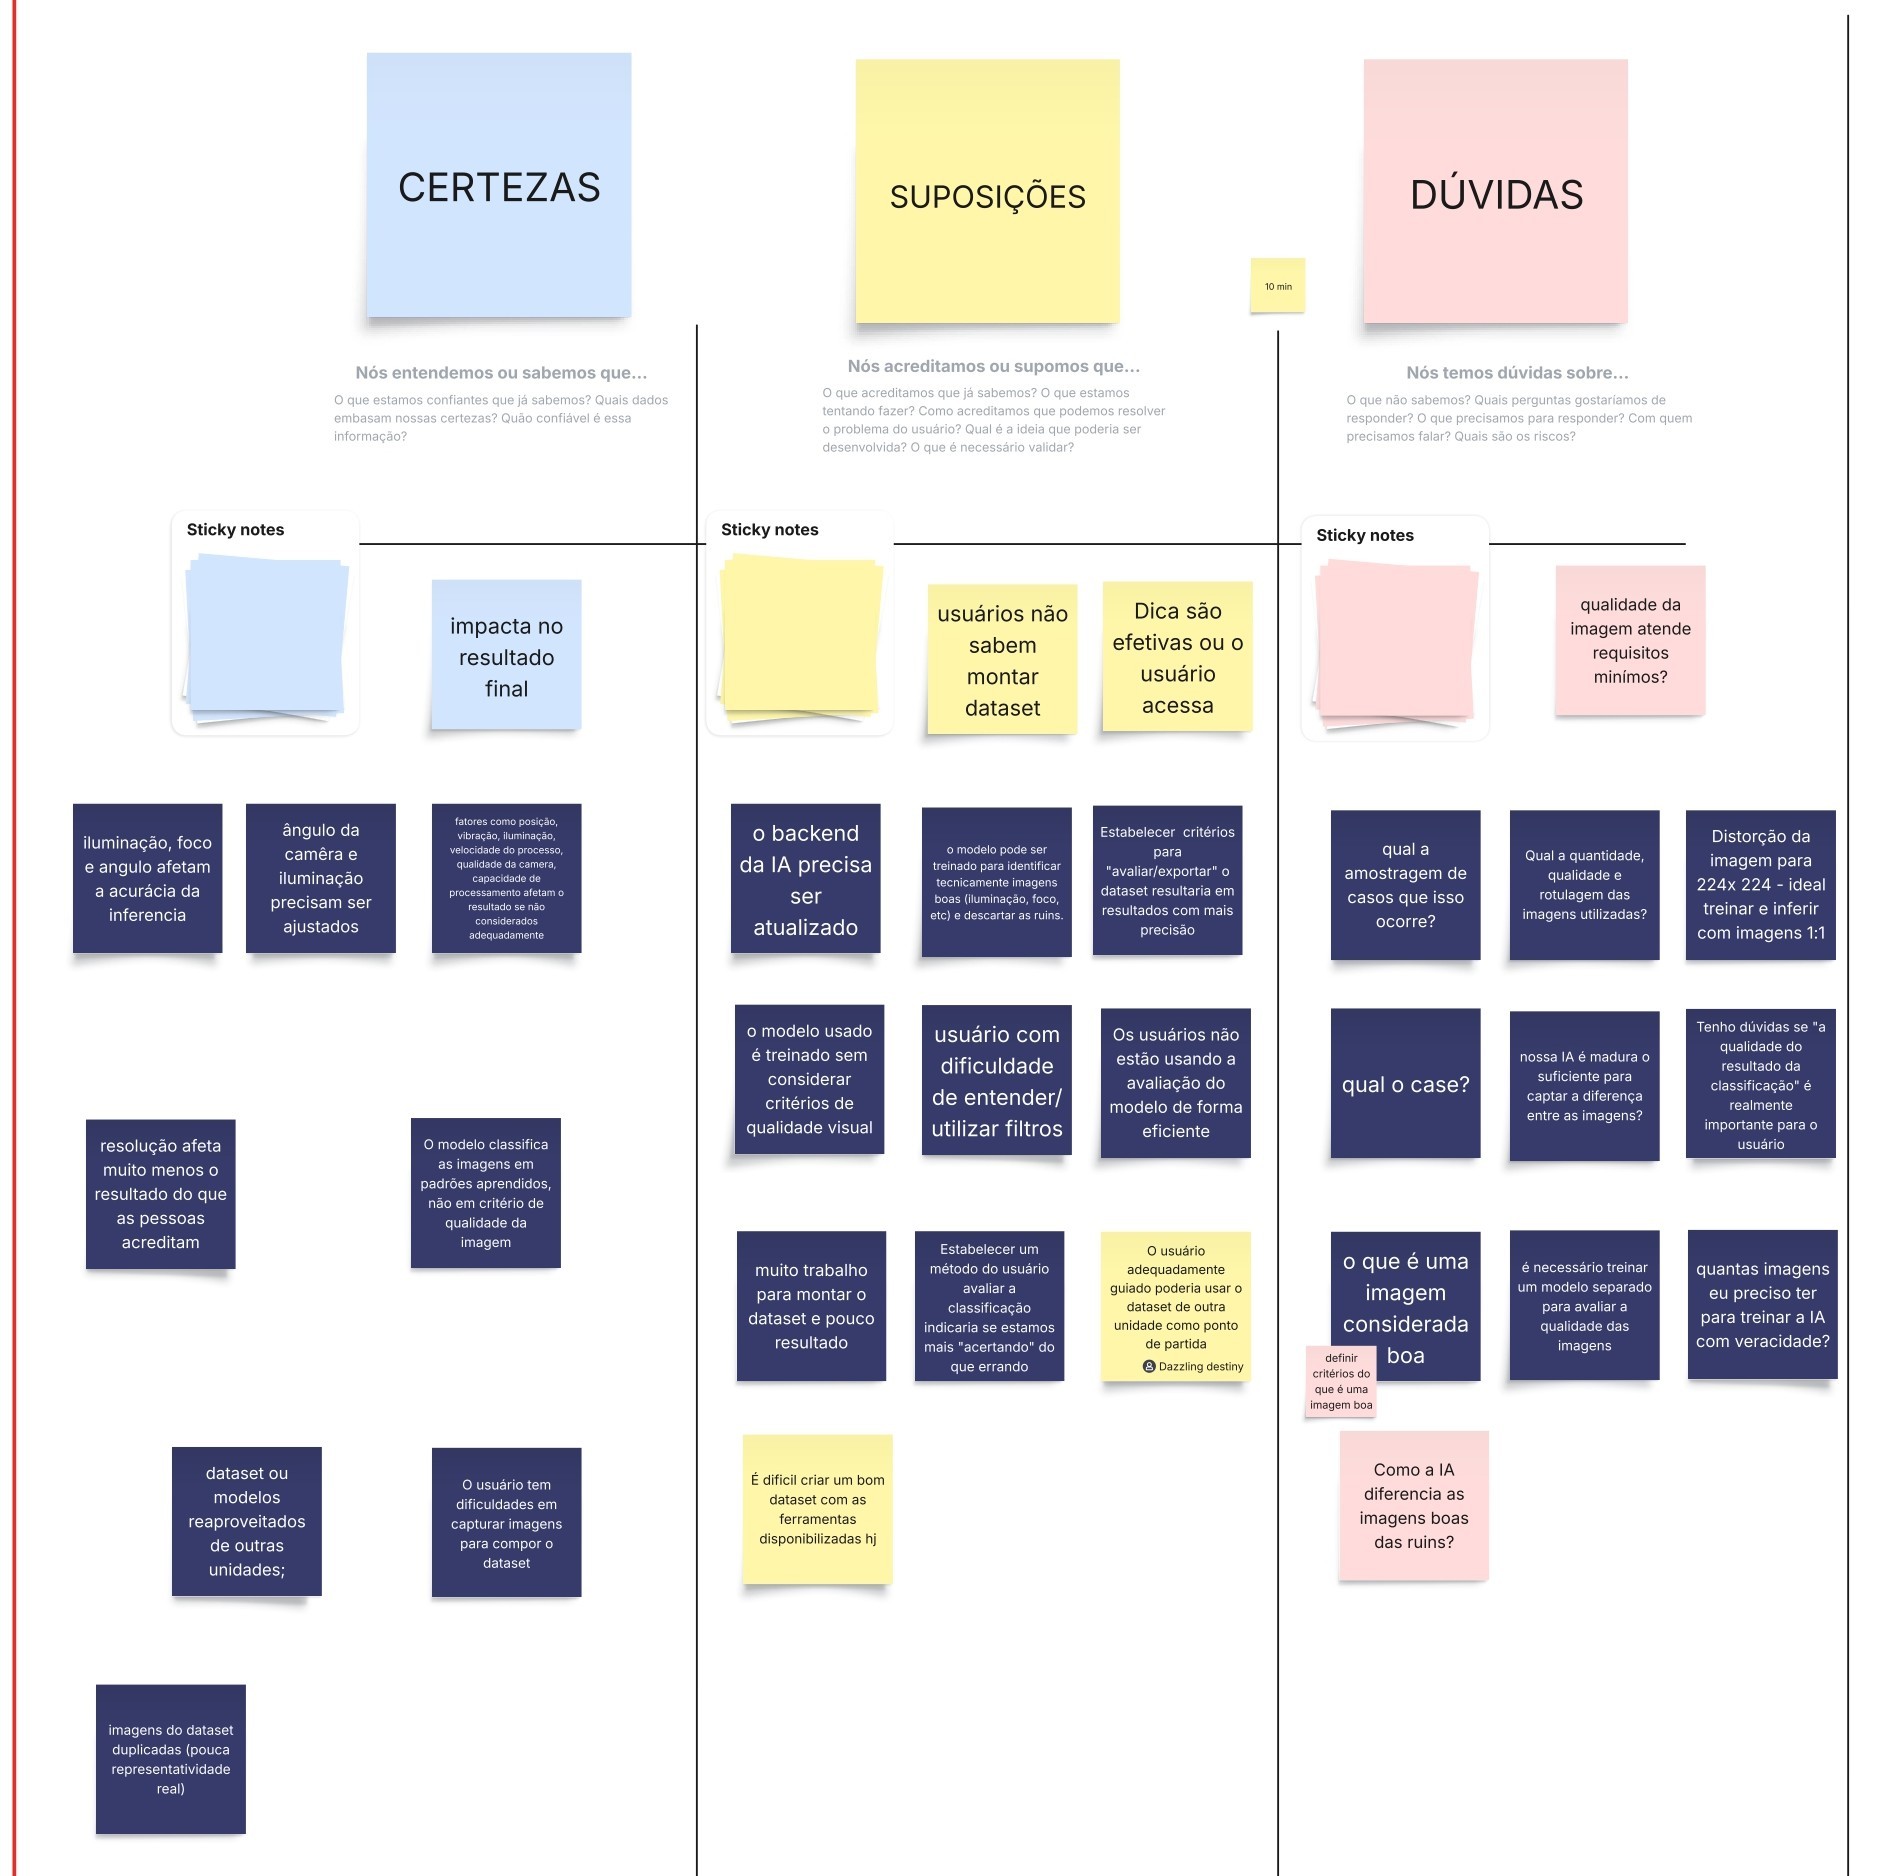
CSD Matrix
As a starting point for making more informed decisions and guiding future actions, we created a CSD Matrix to ensure that all team members have a shared understanding of the context, avoiding errors and delays and extracting as much knowledge as possible for the project.
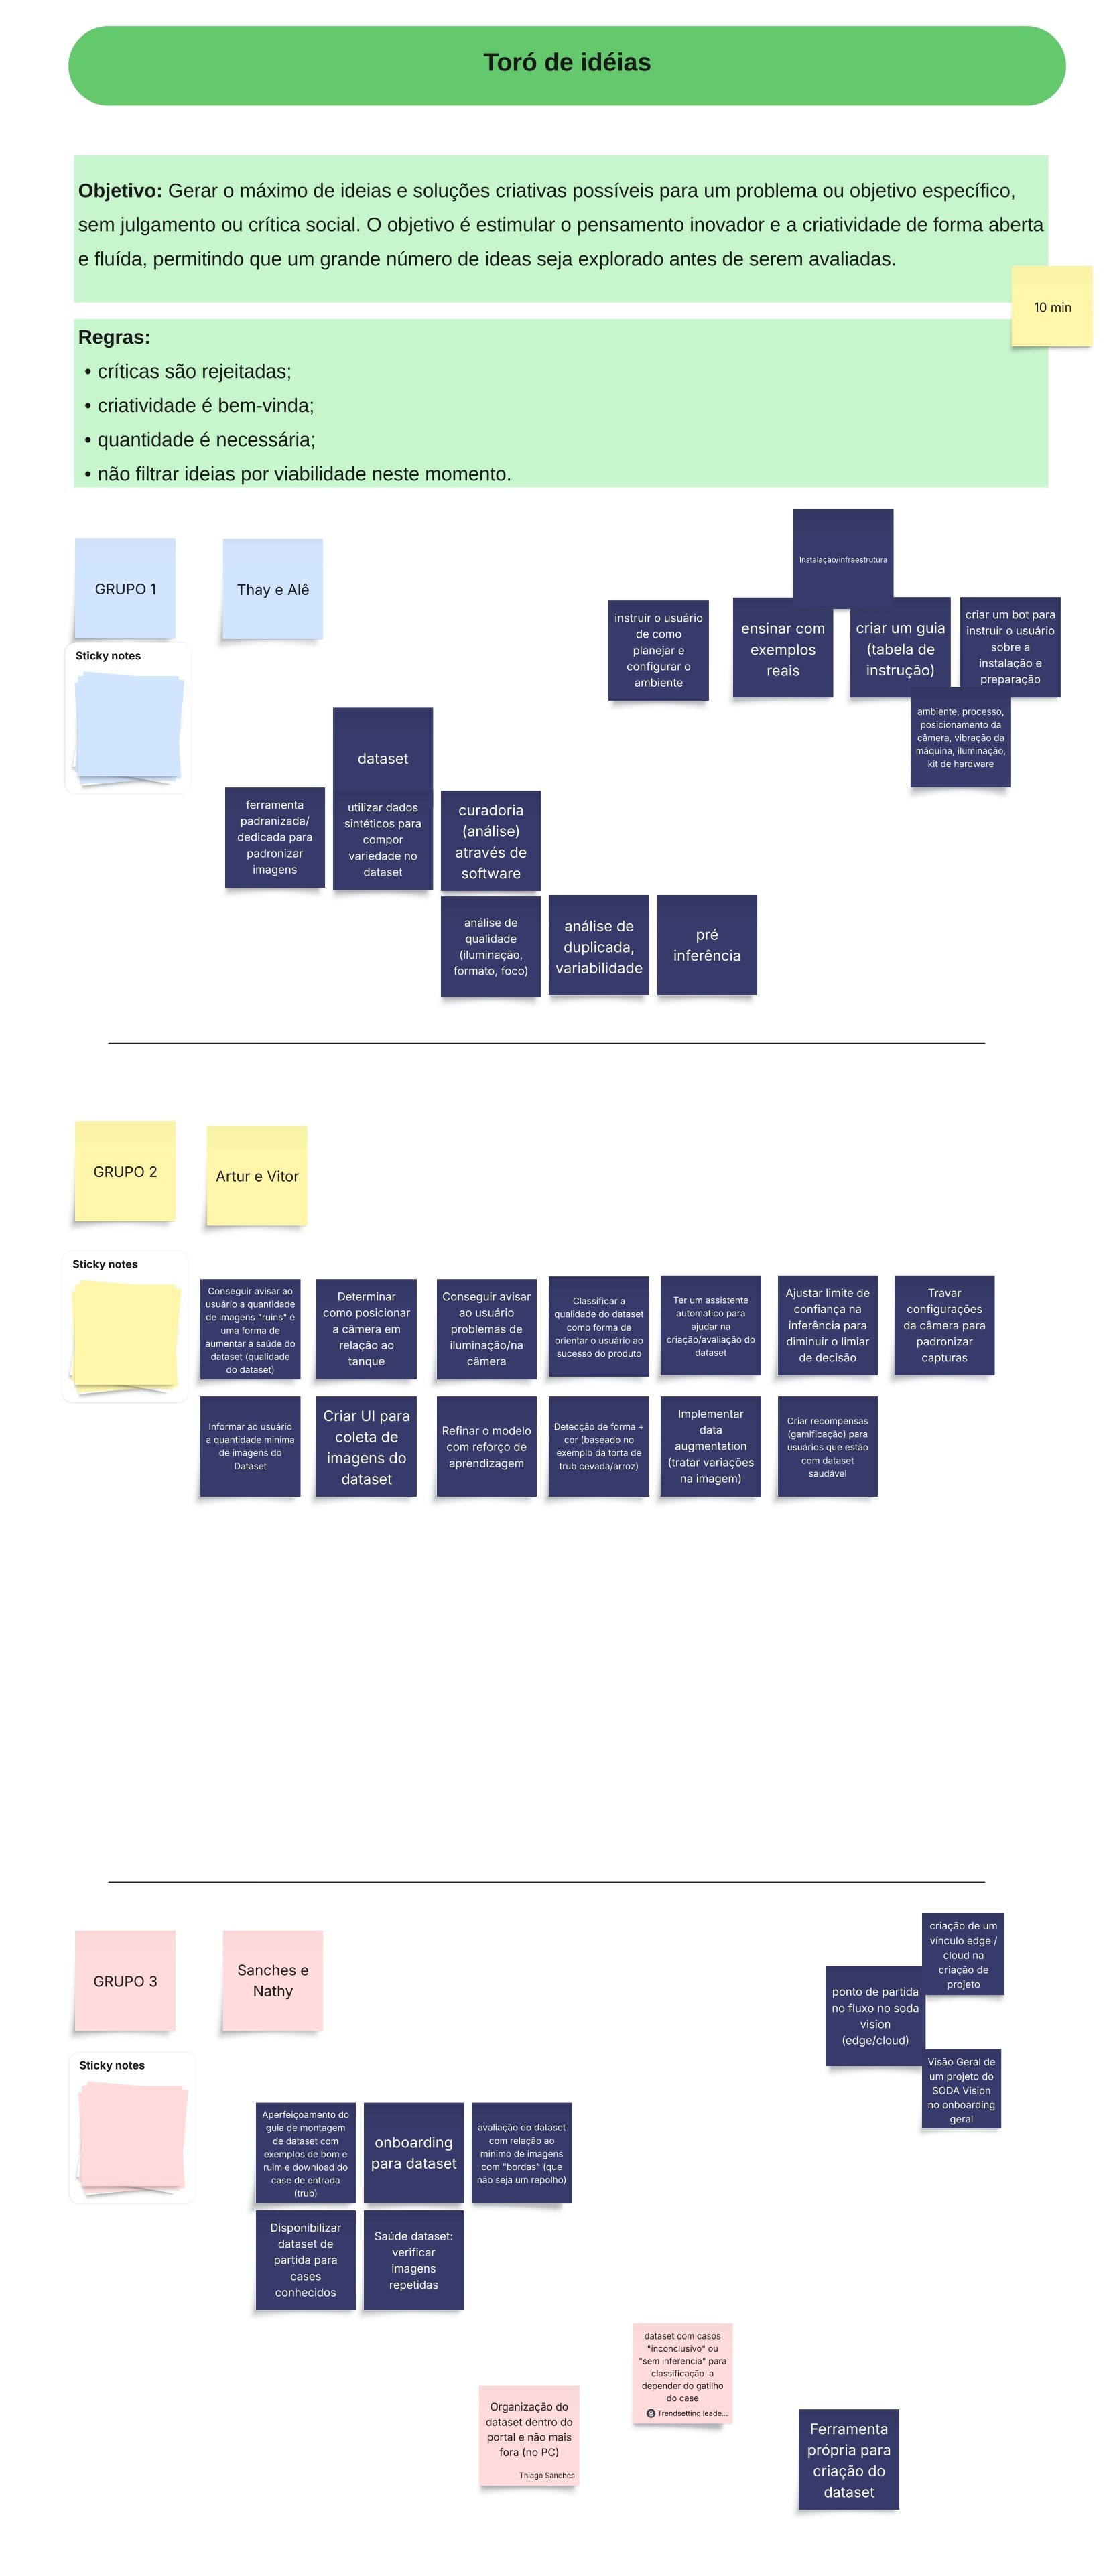
Brainstorming
After completing the CSD Matrix activity, it was time for a brainstorming session with the team to generate as many ideas as possible:
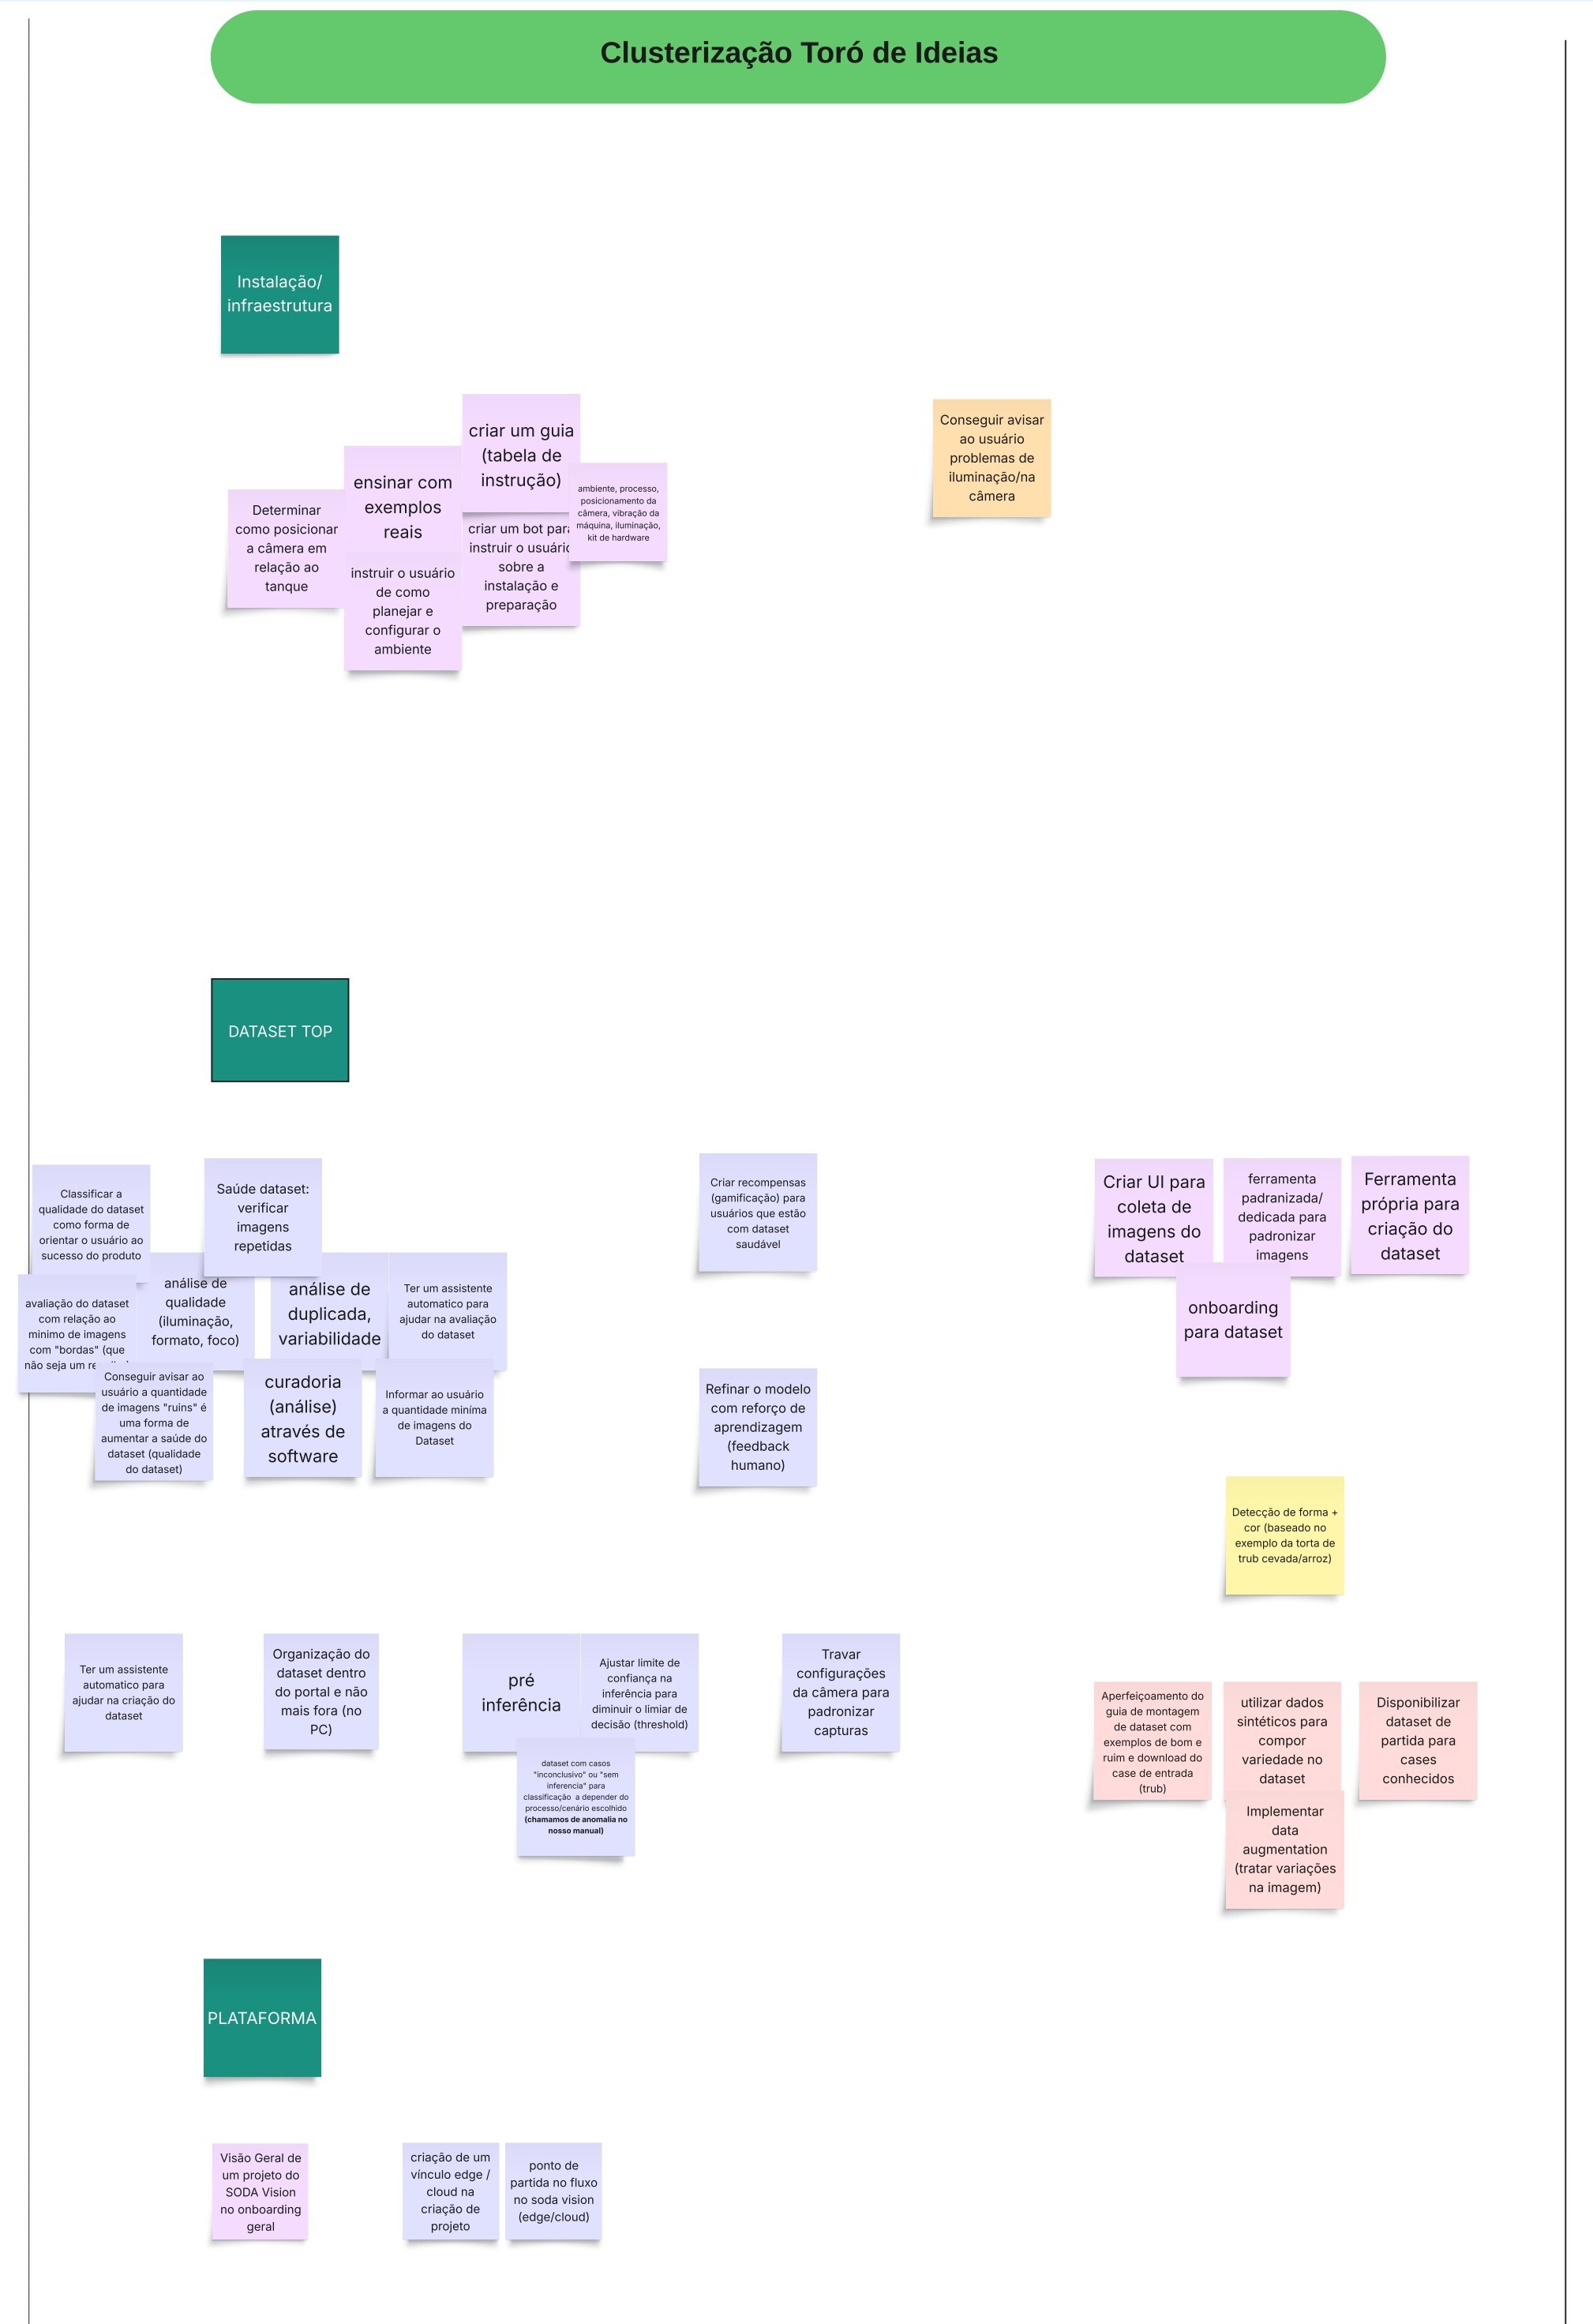
Clustering
After generating the ideas, the PM and I divided them into groups by theme:
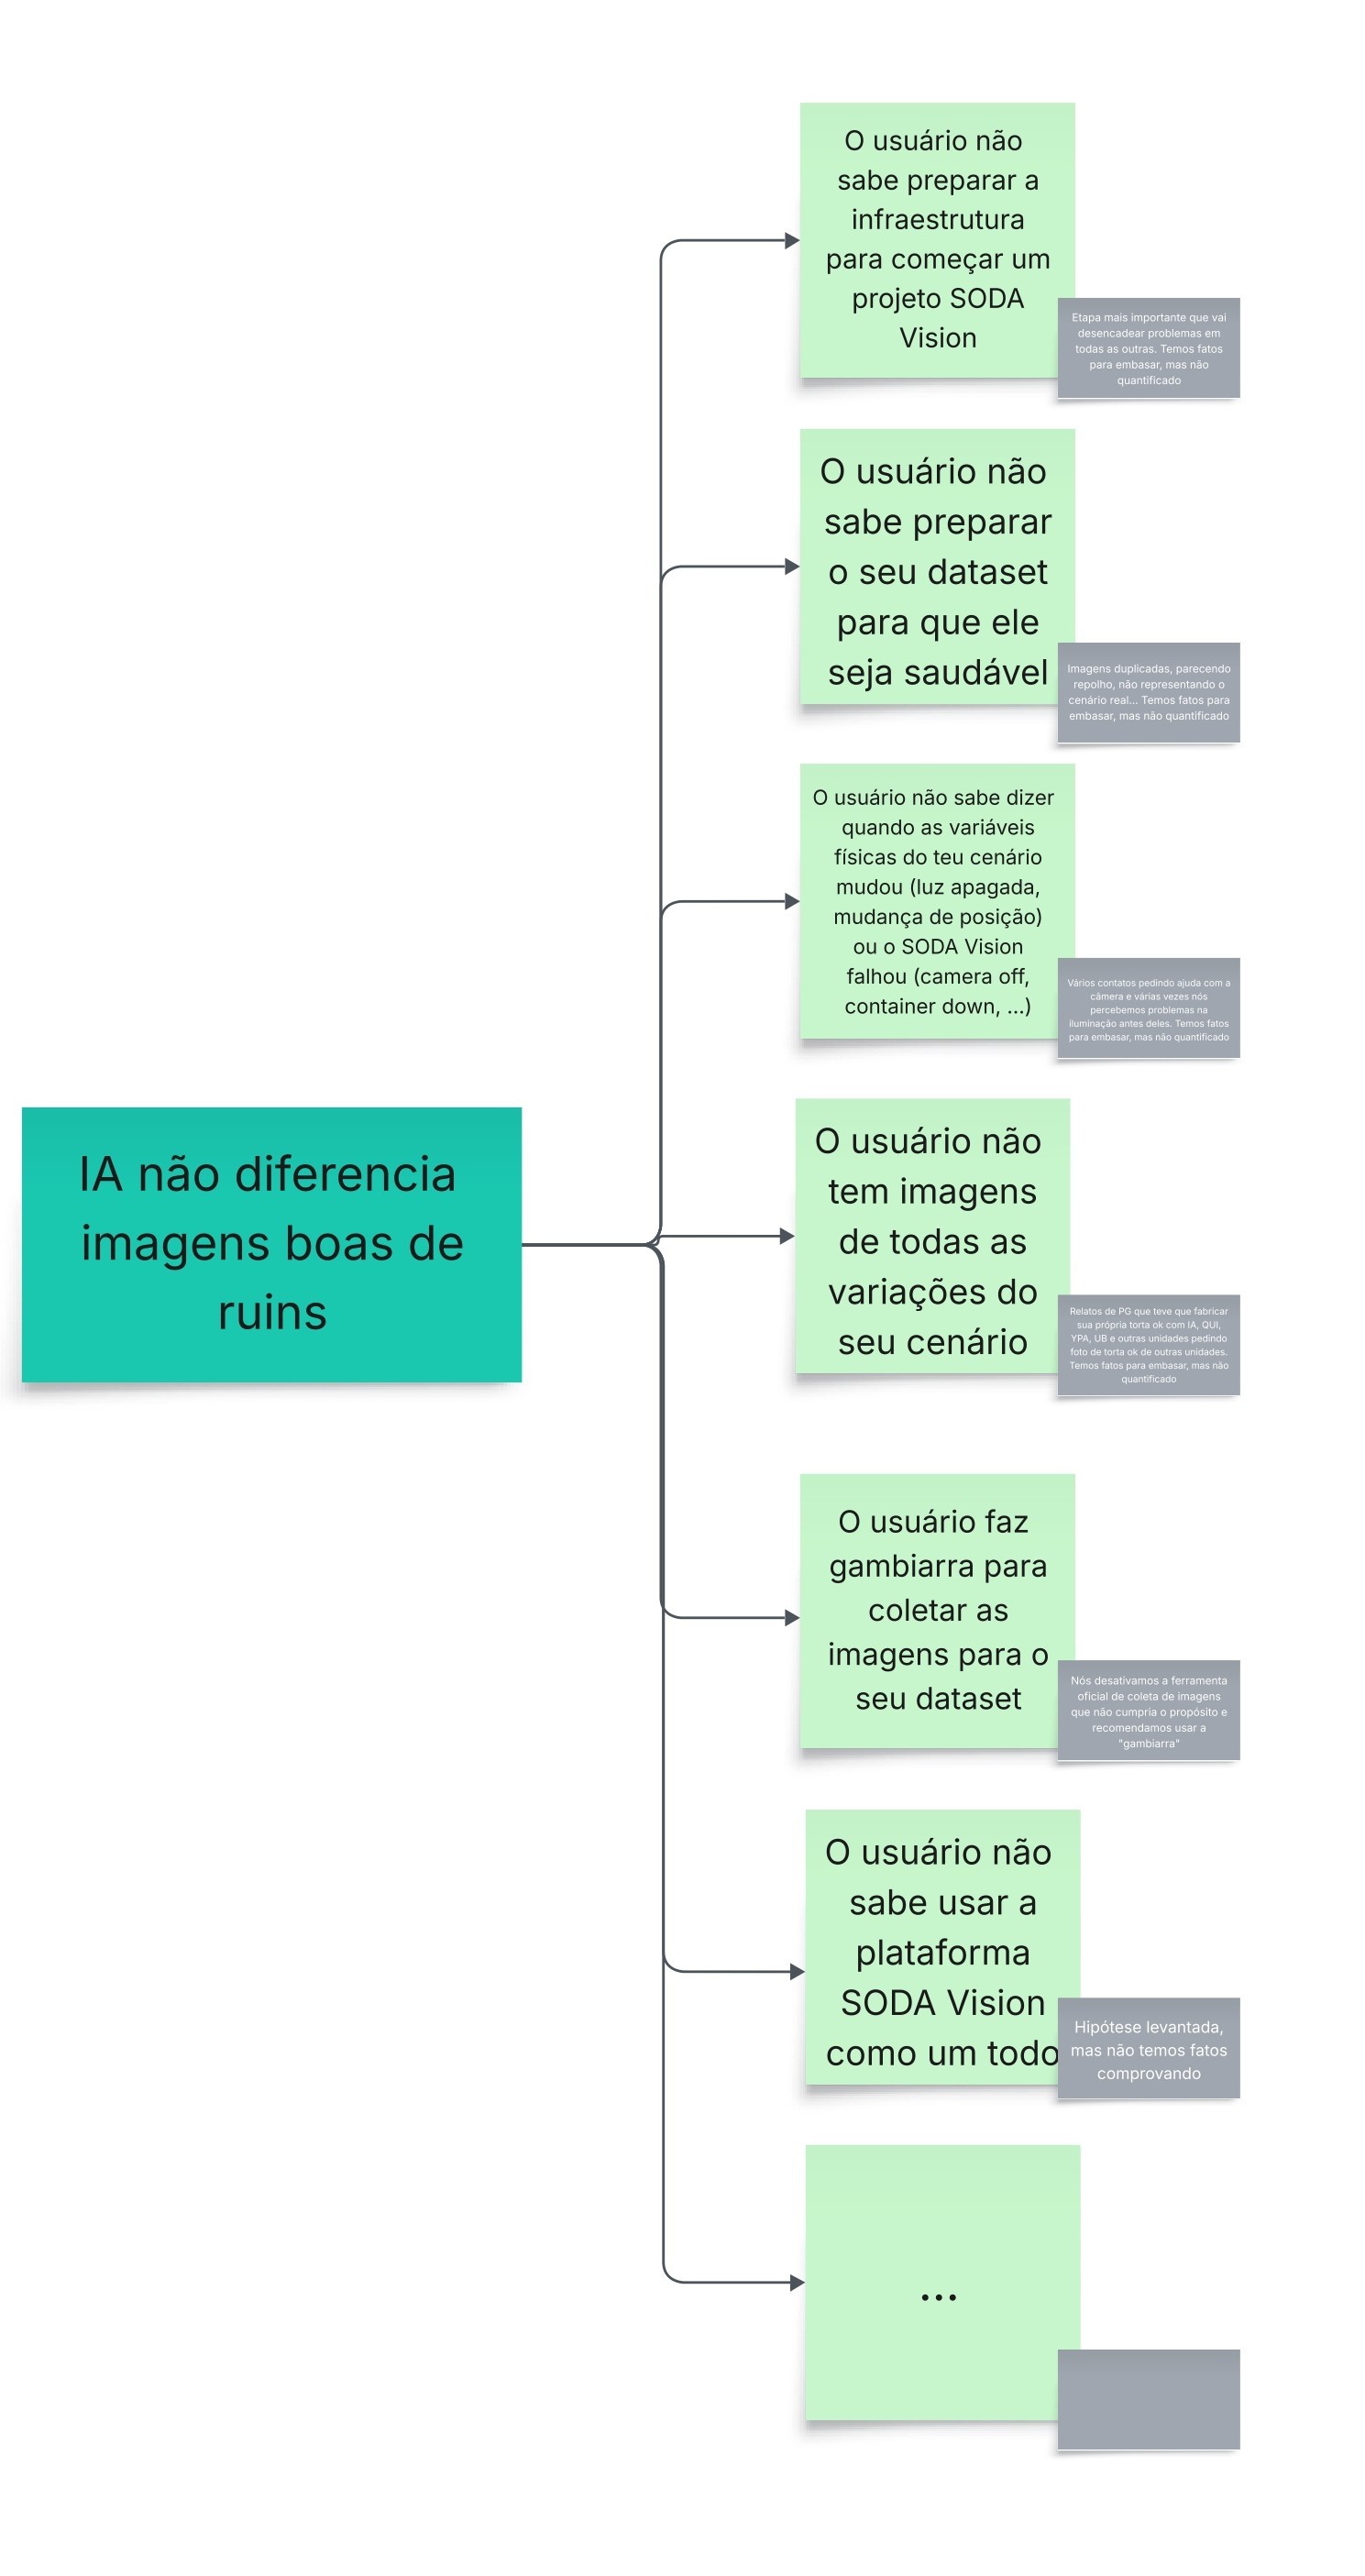
Opportunity Solution Tree
At Ambev, we draw heavily from Teresa Torres's (Continuous Discovery Habits) approach and try to utilize her teachings as much as possible within the company. One tool we use frequently to avoid getting lost in the sea of opportunities is the Opportunity Solution Tree. We had a chaotic jumble of ideas generated during brainstorming sessions, and we used this technique to structure them.
Hypothesis creation
The time has come to gather and prioritize ideas for solutions that can address the opportunities, and then we will map the 4 main risks of these hypotheses.

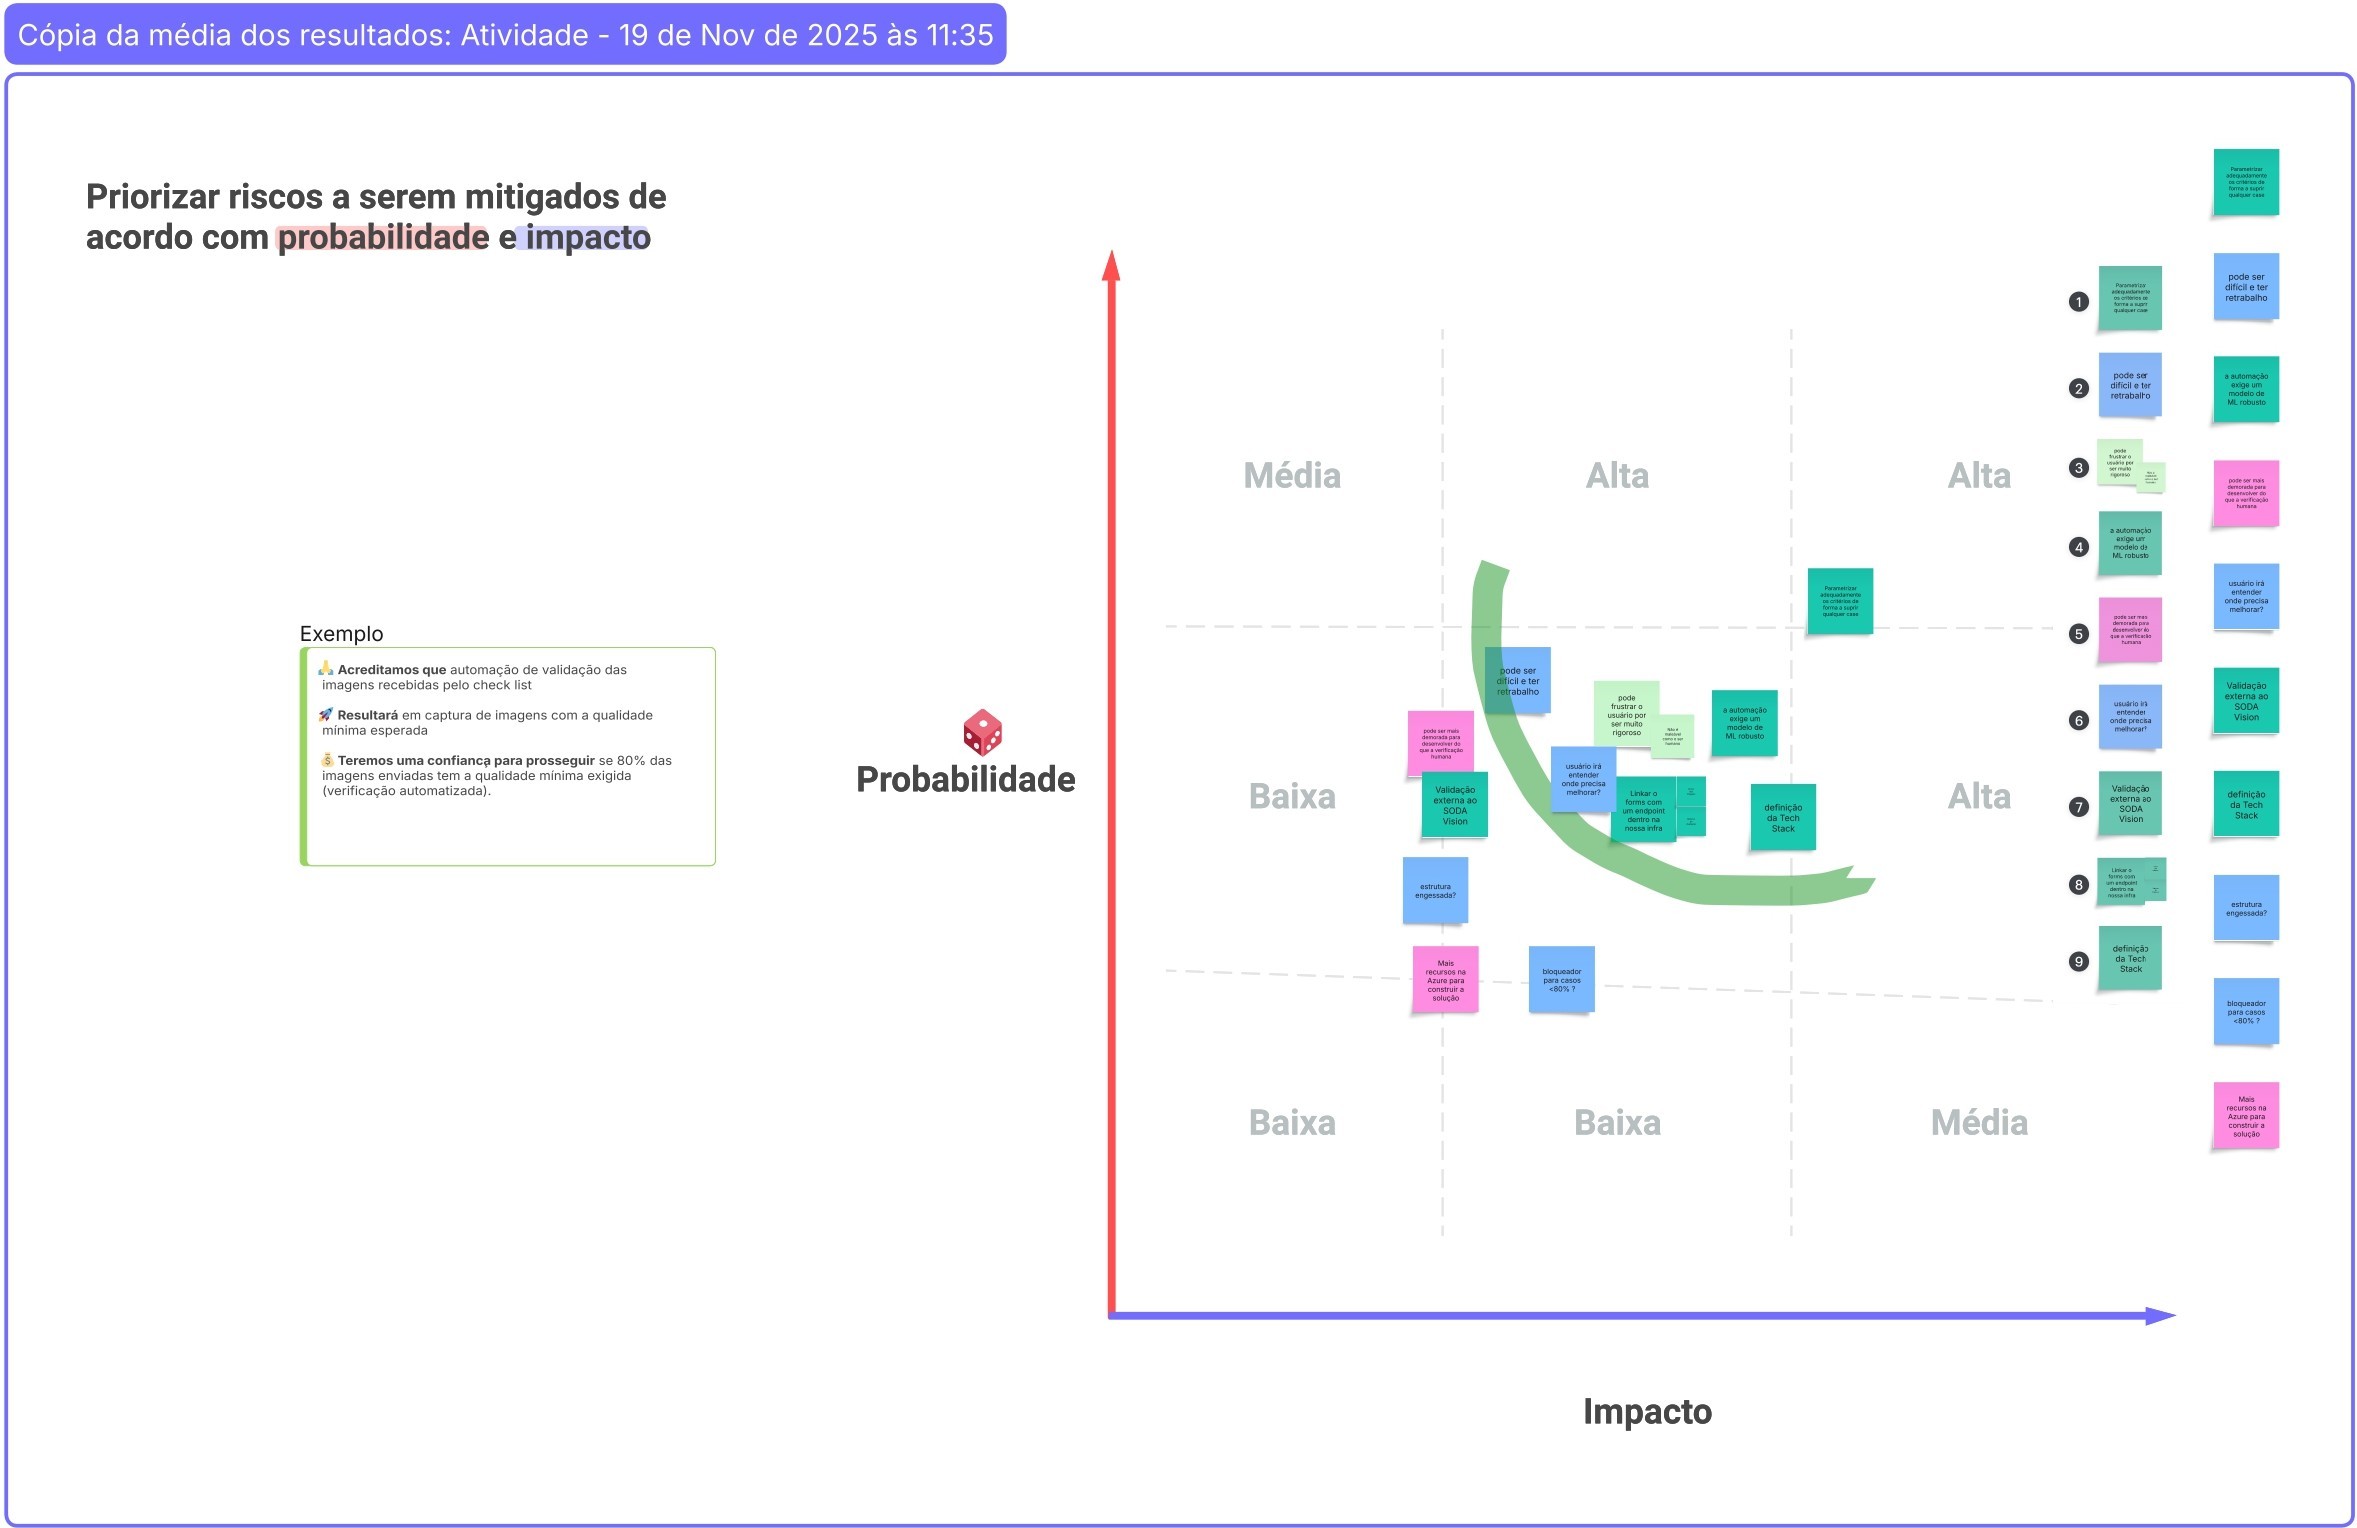
Risk Mapping
Risks are uncertainties that can affect the success of a proposed solution. Therefore, we map the risks and prioritize the hypotheses, and consequently prioritize which risks will need to be mitigated through experimentation.
Experiment
We established experiments for the risks that were prioritized in the previous step and executed these experiments. After execution, the data and results obtained are analyzed, and then it is decided which hypothesis will be pursued for the construction of the feature.

Results
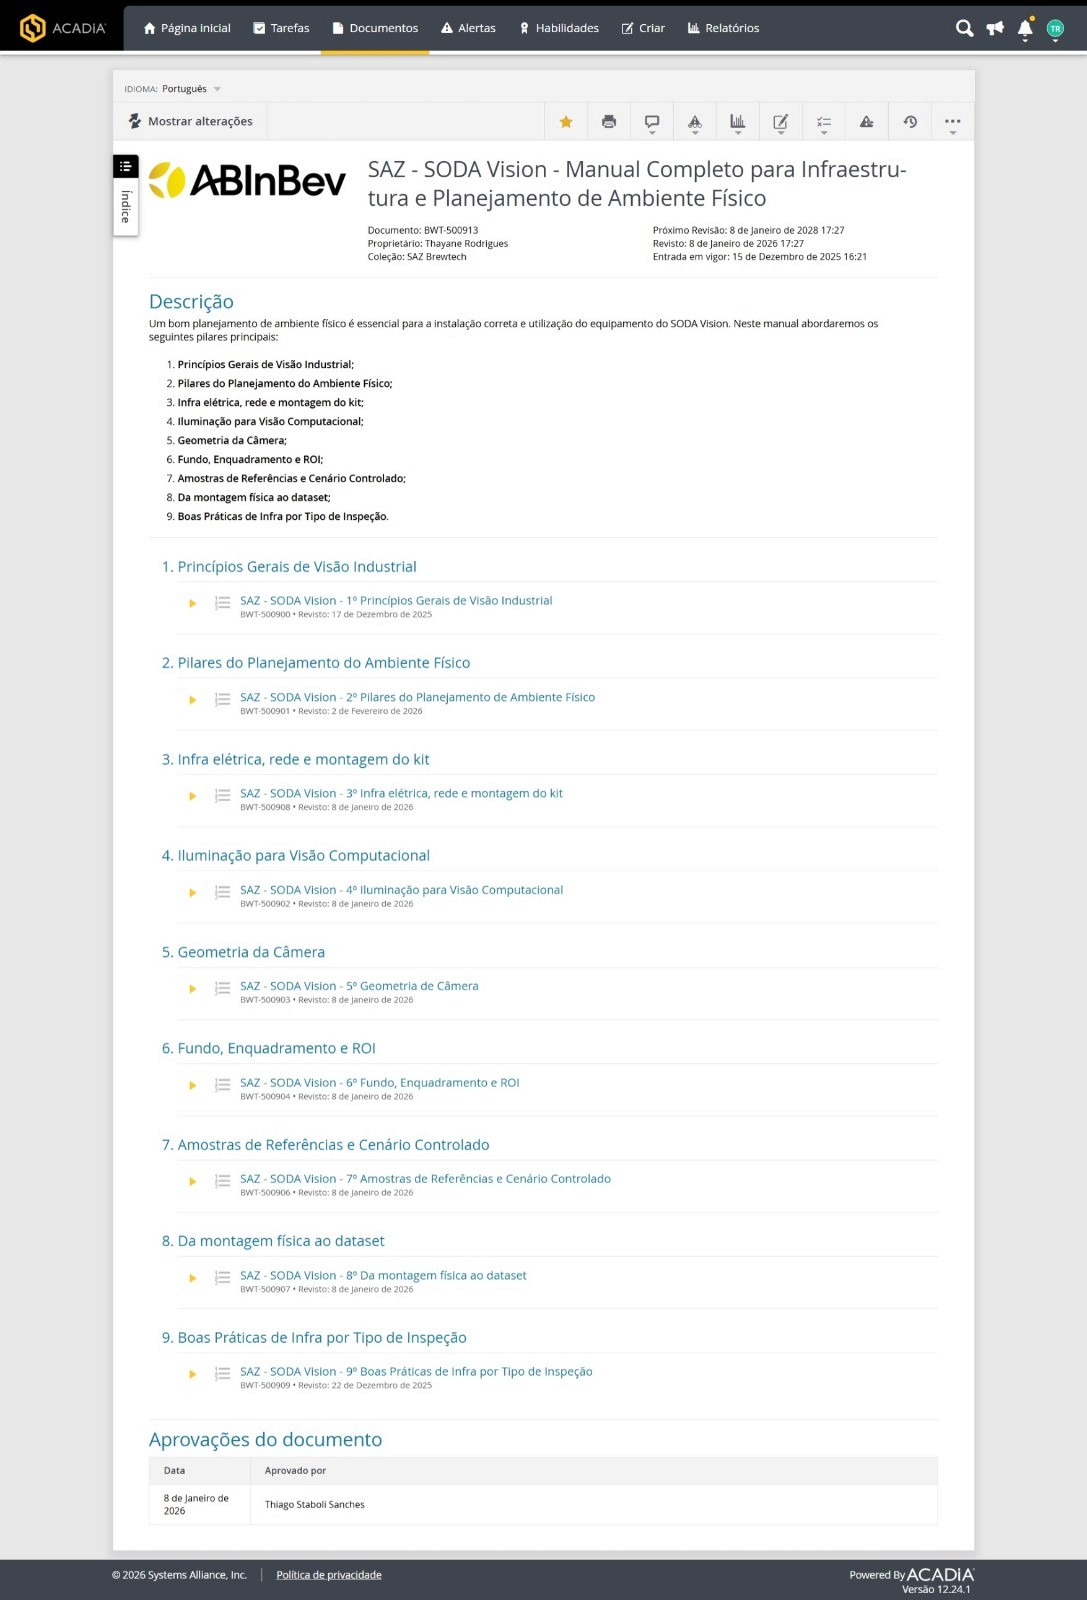
Complete Manual for Infrastructure and Planning of the Physical Environment
This deliverable wasn't a screen or workflow, but a complete manual guiding users step-by-step on how to prepare the environment, perform the installation, and correctly assemble the dataset. This was something users needed, and we identified the need for it in our research and implemented it in the experiment. I created 9 tutorials within 1 month, which together formed the manual. This is the official documentation within the company.
Project Management
The goal was to improve project management by providing users with a space where they could view all the projects they had created.

User control
The SODA Vision studio area had a resource limitation, allowing only one user at a time. It was necessary to create a mechanism to inform users when the studio was already in use.

New business rules
Updates to the Project Template statuses, making it easier for users to know what is up-to-date and what is out of date, and also the adoption of tooltips that did not exist before.

Next project