02
details
Year
2024 - 2025
Role
UX/UI Designer
sector
Star up
Context
Rota Financeira is a small Brazilian startup focused on developing a product that helps ride-hailing drivers manage their finances and vehicle maintenance, efficiently balancing income, expenses, and goals. Additionally, the app helps drivers organize and remember important maintenance tasks, preventing unexpected expenses and wasted time due to unplanned stops.
The product's users are app-based and food delivery drivers who use cars and motorcycles for work and often lack a clear understanding of their earnings and expenses. The situation for these drivers demands much more than just skill behind the wheel; it requires a fleet manager mindset. With rising operational costs (fuel and maintenance) and increasingly complex fares, drivers who don't keep track end up "paying to work."
The Problem
With rising operational costs (fuel and maintenance) and increasingly complex fares, many app drivers are unable to organize their finances and, as a result, when their car breaks down, they don't have the money to maintain it.
Objective and goals
The goal was to create an app aimed at ride-hailing drivers that had features such as: financial control, expense tracking (including maintenance), statistics, etc.
Possible features to address user pain points:
Maintenance expense management;
Fuel expense management;
Charts;
Integration with the Uber API;
Statistics;
Registration of recurring customers.
My role
My role in this project was to build the app's MVP together with the founder, the PM, the developers, and the other designers, aligning expectations and strategies. I was also responsible for initiating the product's first Style Guide, which was designed following Material Design best practices and WCAG accessibility guidelines.
Initial research
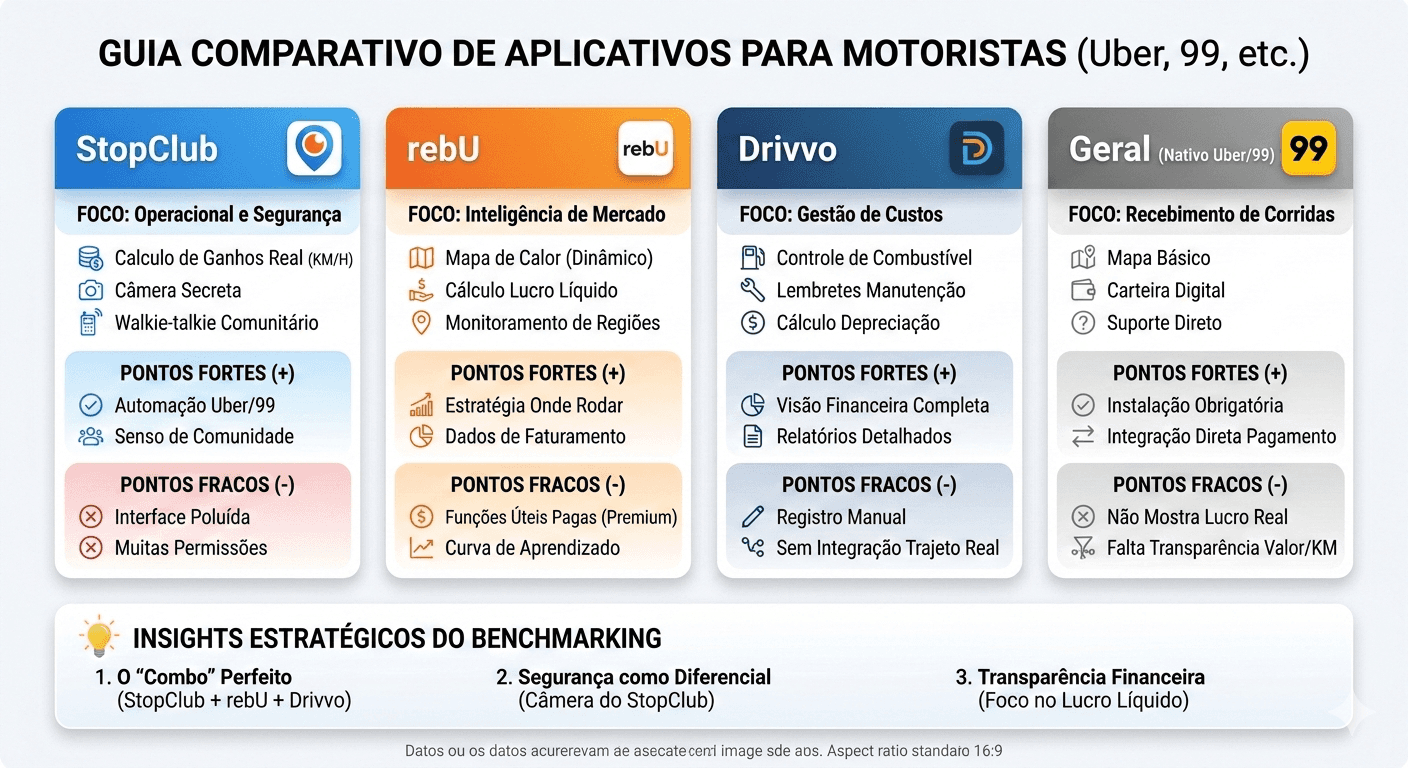
Now it's time to learn about the products already on the market and who our competitors will be. To make it easier to understand, I've created a table:
After conducting desk research and benchmarking, it was time to do our own user research. Our goal was to discover, from real users, the pain points and opportunities that would influence the overall project roadmap. The research was carried out in two stages: the first was a screener (quantitative) and the second was an interview with 5 users (qualitative).
To achieve the objective, the research needed to identify the project's target audience (motorcycle taxi drivers and app drivers and/or food delivery drivers) and map the users' real needs (financial management, security, vehicle maintenance, etc.).
Assumption: "That professionals working in transportation and/or delivery apps have difficulty managing their own finances and would use an app for this purpose to control and increase their earnings in this activity."
Recruitment criteria:
Men who work as app drivers, motorcycle taxi drivers, or food delivery drivers;
Up to 40 years of age;
2 from the Southeast, 1 from the Northeast, 1 from the South, 1 from the North, and 1 from the Midwest.
With an income of 2 to 5 minimum wages.
We recruit online, from friends and family.
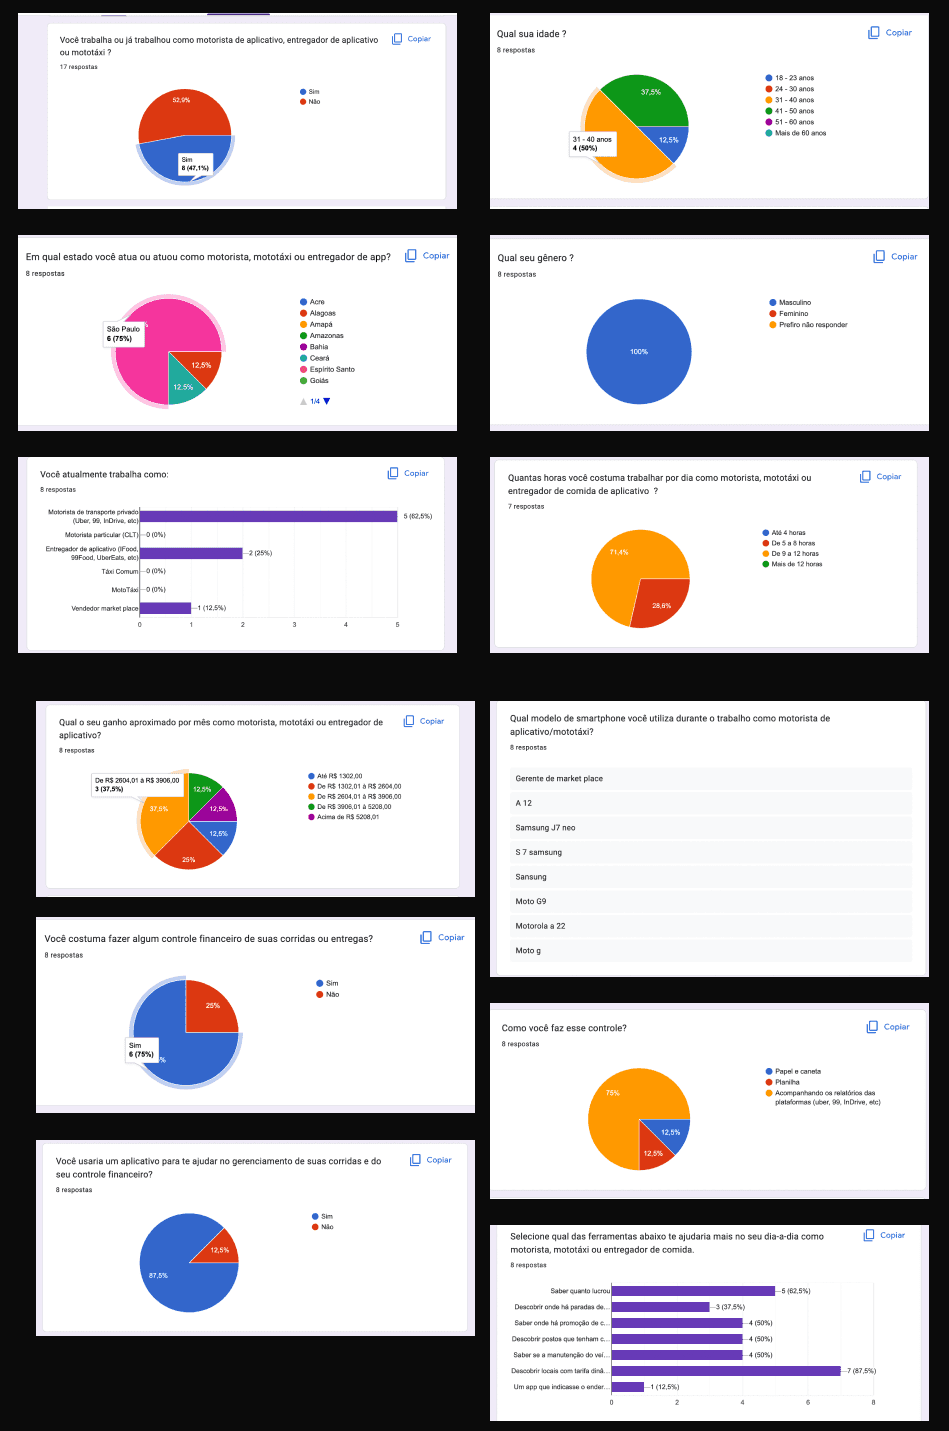
Results
After the research was conducted, the results were compiled in Excel and transformed into graphs:
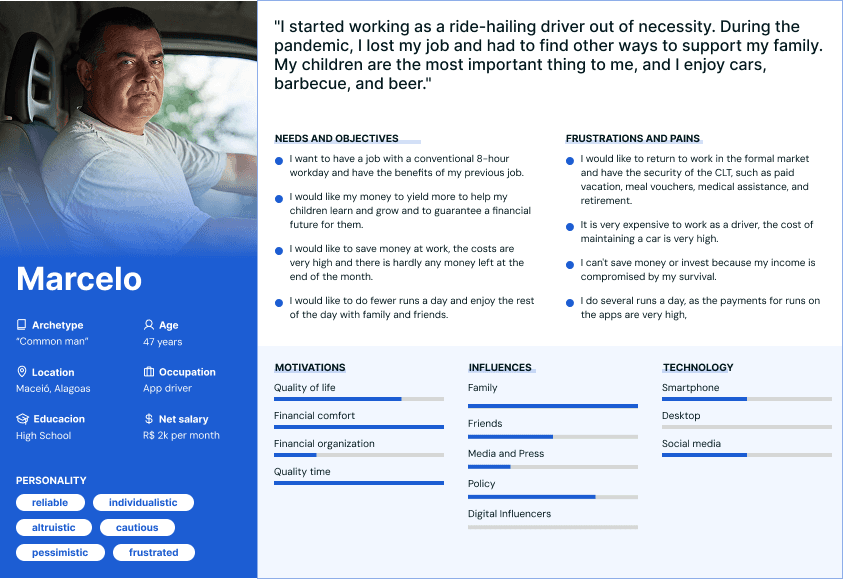
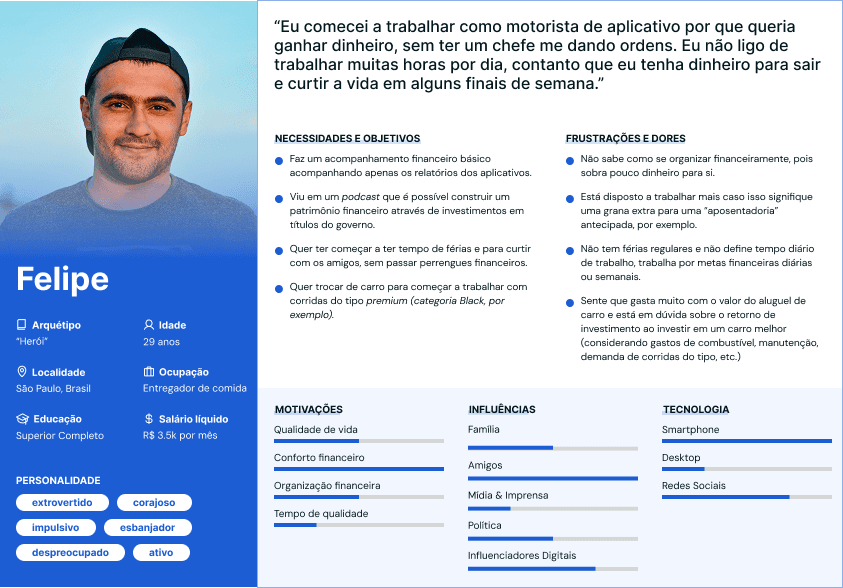
Now that the research is complete, we've put together 3 profiles of pernosa for our project:

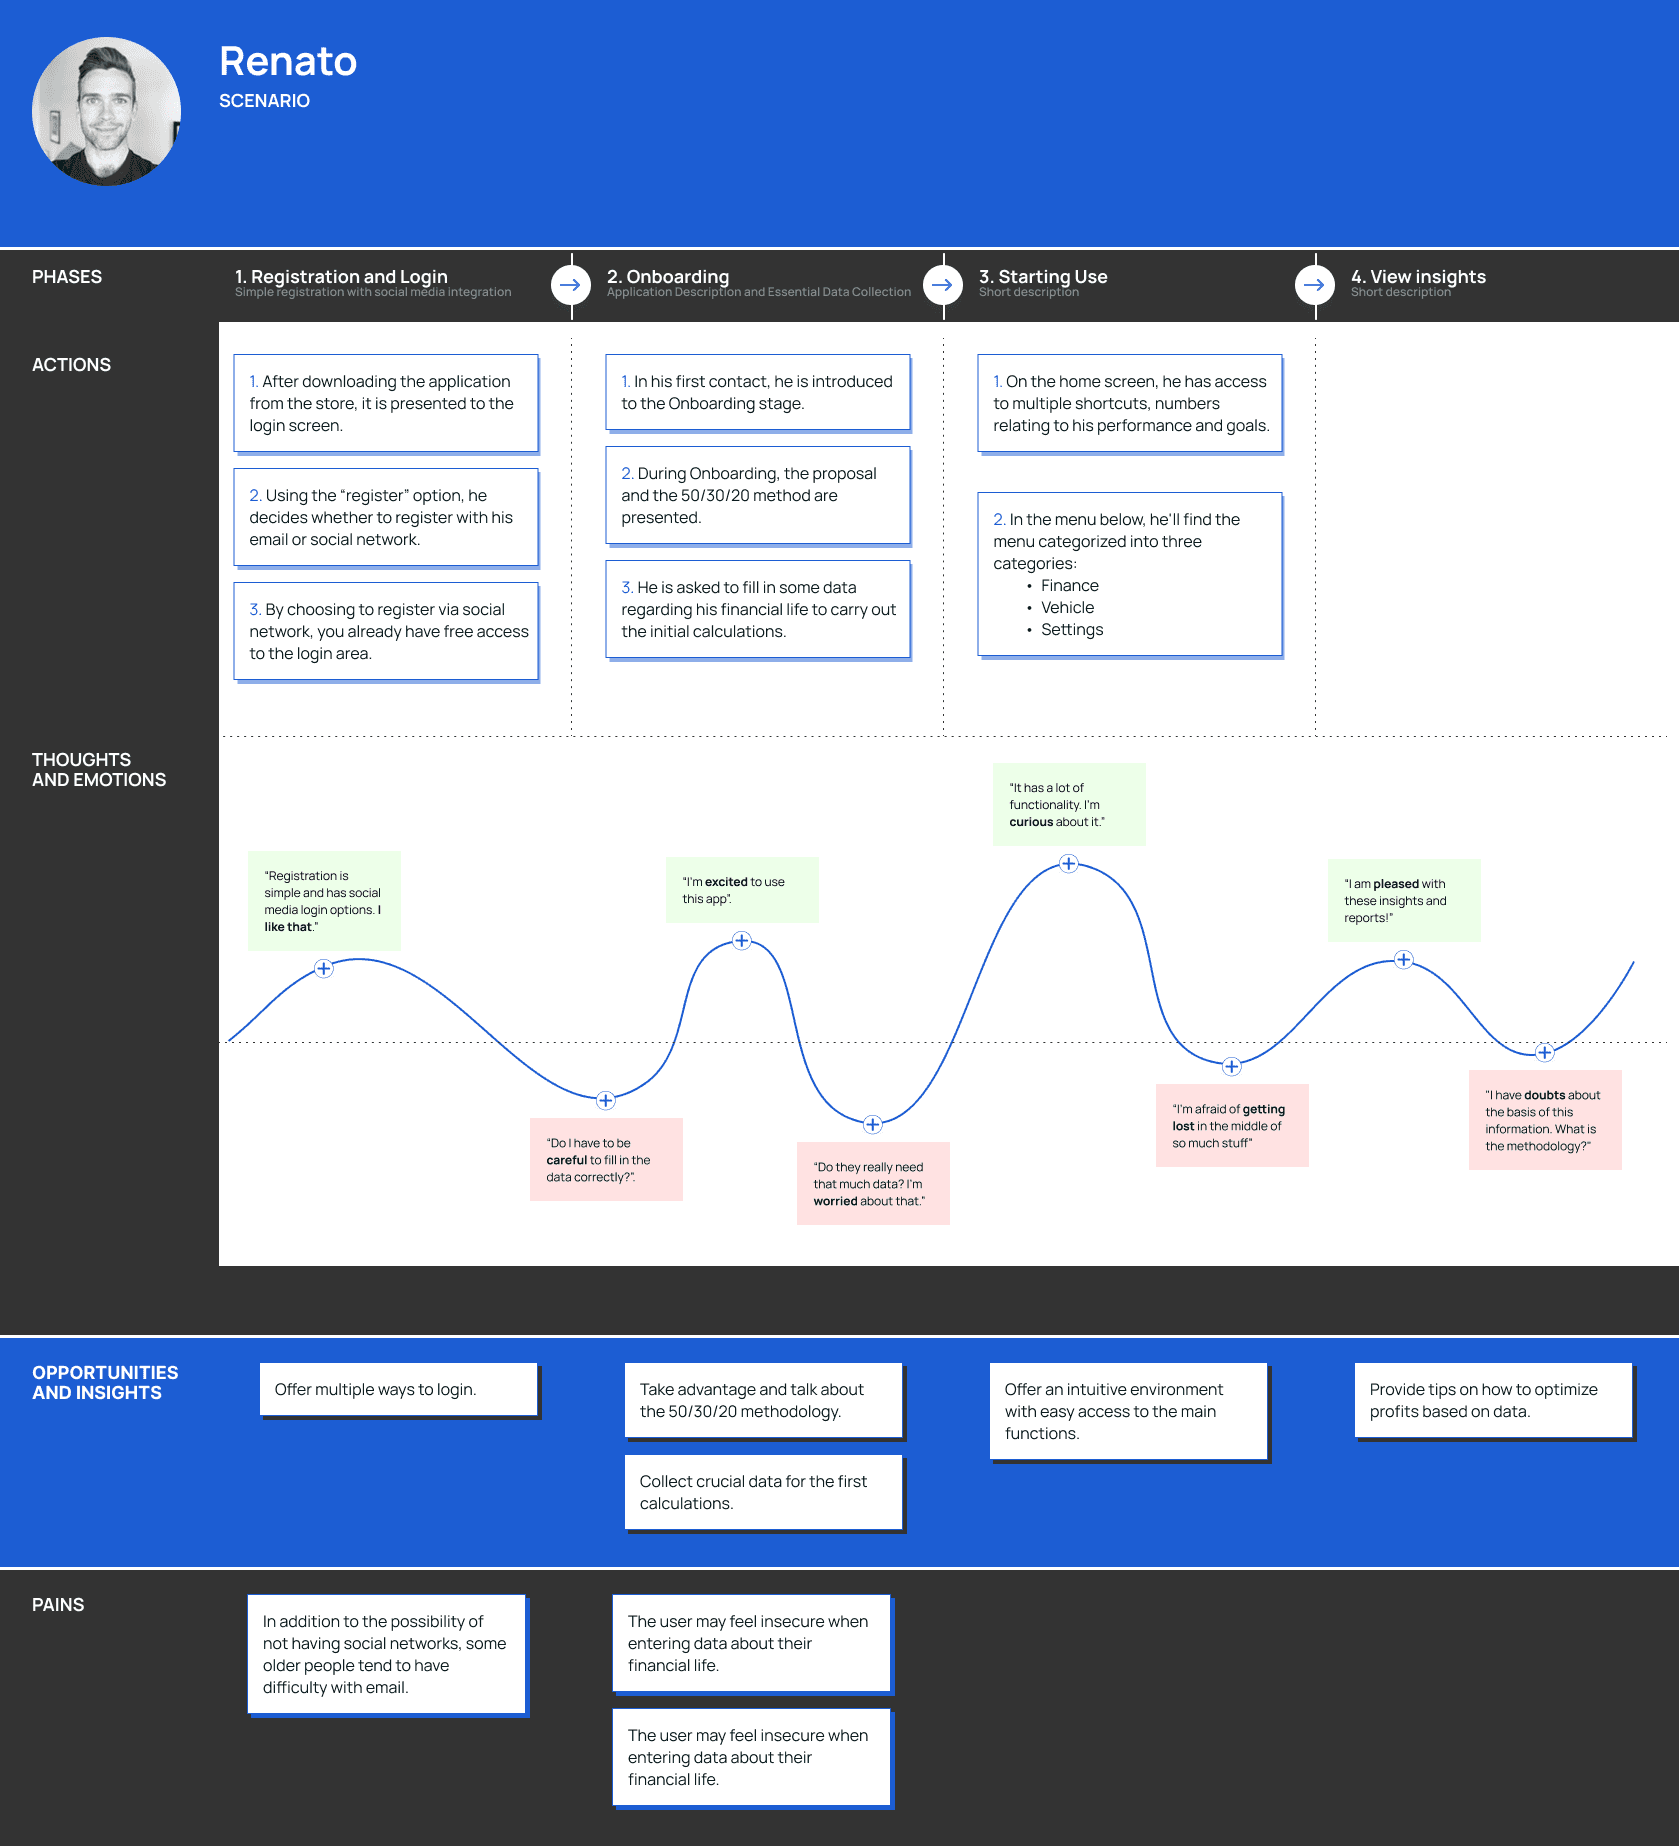
We also created a user journey map to illustrate the steps involved in the app registration process, identifying challenges faced by users, potential solutions, and opportunities for our product.
UX Ideation and Decisions
The ideation phase aimed to transform the main research insights into practical and accessible solutions for the daily lives of ride-hailing drivers.
Considering the users' busy routines and the difficulty in maintaining complex financial records, the team opted to start the product as an MVP, focused exclusively on vehicle maintenance expenses. Expenses such as fuel, insurance, and other recurring costs were mapped for future product phases.
This decision allowed for reducing the initial complexity of the experience, validating the product's value with users, and facilitating adoption in daily use.
Key UX decisions:
Focus on a single type of expense in the MVP.
By concentrating the MVP solely on maintenance, it was possible to create simpler and clearer flows, avoiding information overload and reducing the user's cognitive effort.
Quick and uncomplicated registration.
The expense entry flow was designed with few steps, prioritizing essential fields to encourage registration even when time is limited.
Clarity in visualizing maintenance expenses.
The organization of the information aimed to facilitate the reading and understanding of how much has already been spent on vehicle maintenance, helping the user to financially prepare for future expenses, instead of just reacting to unforeseen events.
Encouraging predictability and prevention.
The experience was designed to encourage continuous monitoring of vehicle maintenance, helping the user to financially prepare for future expenses, instead of just reacting to unforeseen events.
These decisions guided the definition of the application's main flows and served as the basis for the creation of the wireframes and prototypes presented in the following stages.
Results
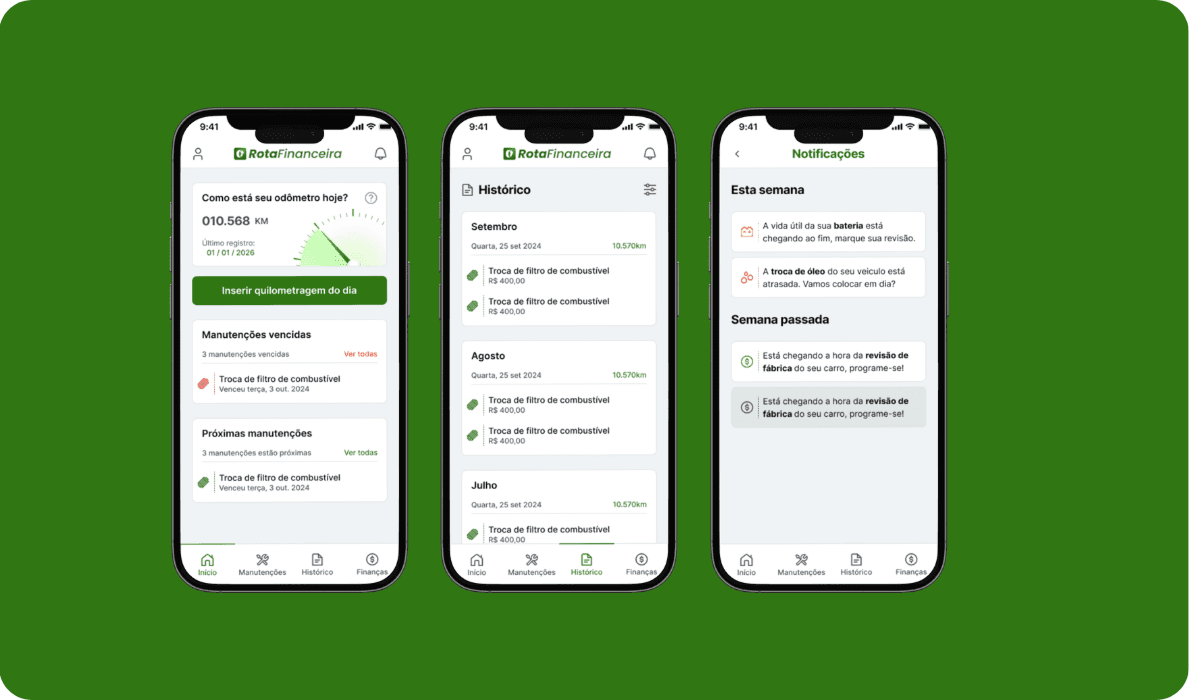
The result for the Rota Financeira MVP is a mobile application focused on organizing, predicting, and planning vehicle maintenance costs, helping drivers financially prepare for recurring expenses and avoid unexpected costs.
More than just recording past maintenance, the product acts as a preventative control tool, combining service history, alerts for upcoming maintenance, and a monthly estimate of how much the user needs to set aside to keep their vehicle in good condition.
The experience was designed to adapt to drivers' routines, with fast flows, simple language, and clear visualizations, reducing cognitive effort and facilitating daily financial decisions.
Main elements of the MVP:
Registration and history of maintenance.
The user can register maintenance already performed, creating a history organized by service type, date, and value. This history serves as a basis for tracking past expenses and feeding future forecasts in the application.
Indication of upcoming maintenance.
Based on the type of service recorded (oil, tires, filters, belt, etc.), the application indicates when a new maintenance should occur, considering time or mileage, helping the driver anticipate the vehicle's needs.
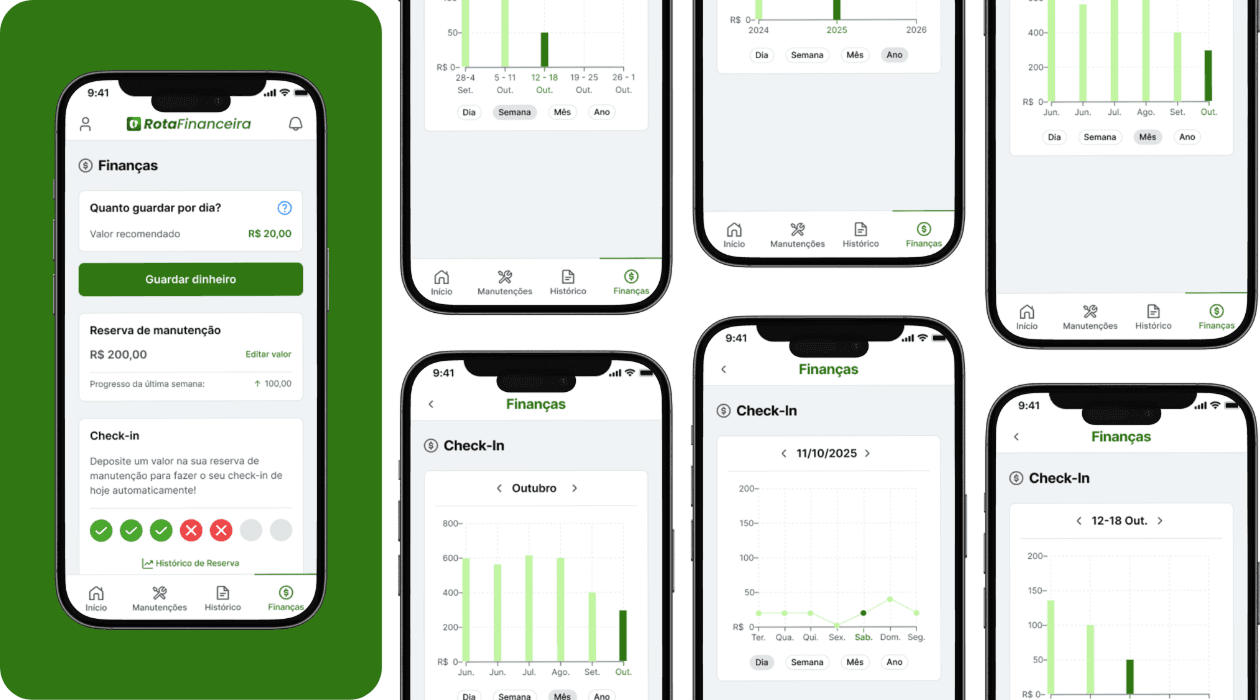
Monthly financial planning.
The solution calculates an estimate of how much the user needs to save per month to cover upcoming scheduled maintenance, transforming one-off costs into a more predictable financial plan distributed over time.
Clear visualization for monitoring.
The application offers simple visualizations of expenses incurred and projected, allowing the driver to understand:
how much has already been spent on maintenance;
what costs are coming;
how these values impact the monthly budget.
Structured basis for product evolution.
The MVP was structured to allow for future expansion - such as the inclusion of fuel, insurance, and other vehicle costs - without compromising the simplicity of the initial experience or the focus on financial planning.
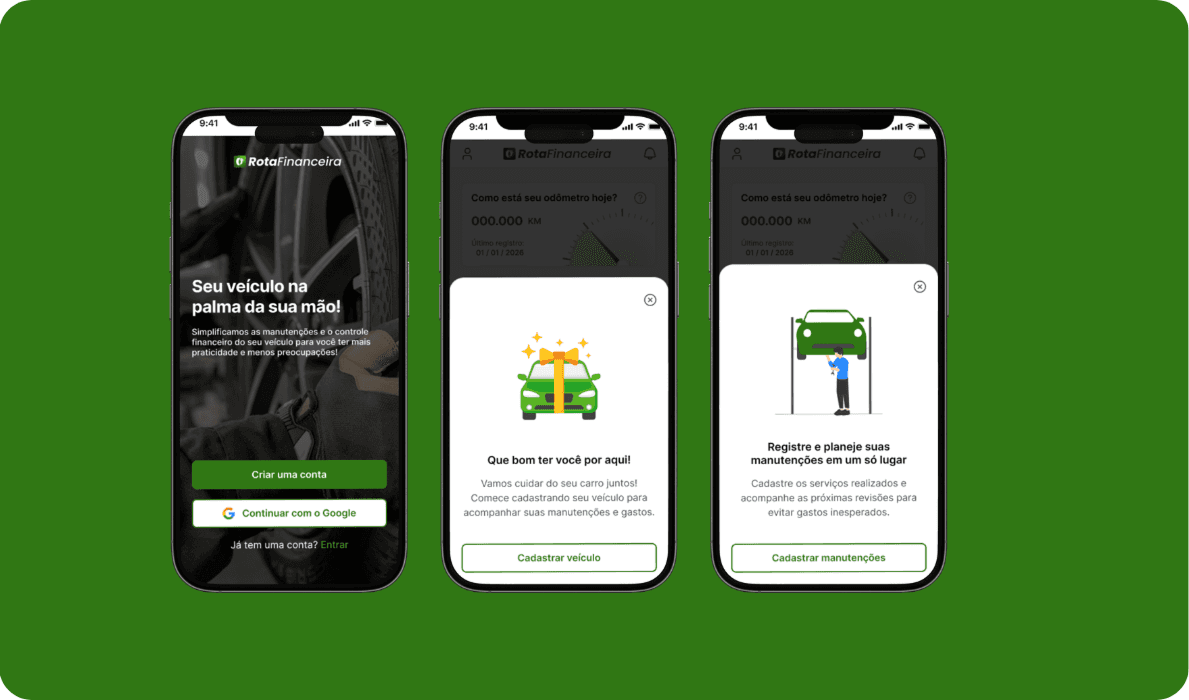
Initial screens of Rota Financeira, preparing the user to organize vehicle maintenance costs.

Simplified registration process, focused on collecting only the essential information to personalize maintenance alerts and forecasts.
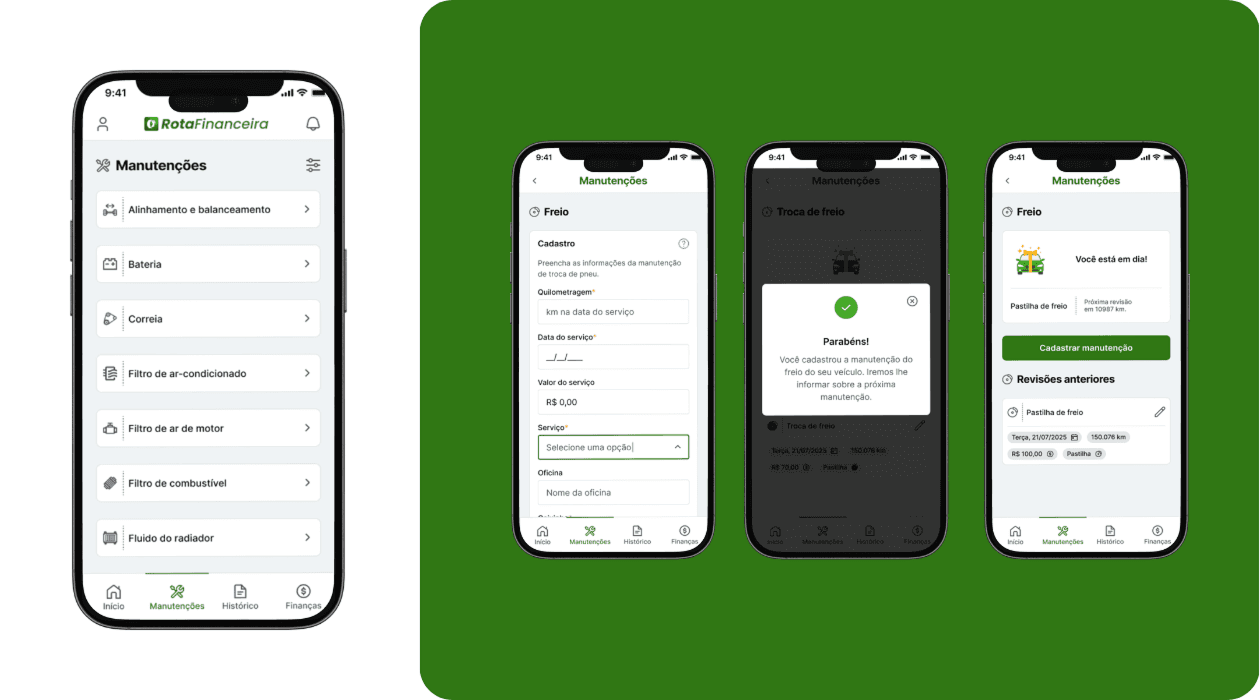
The user logs maintenance performed with few mandatory fields, reducing friction and encouraging continued use of the product.
Based on the driver's history and upcoming scheduled maintenance, the app helps drivers plan their finances by indicating how much to set aside each month.
The screens above illustrate the scope of the MVP, focused on vehicle maintenance and financial planning, validating the product's value before expanding to other types of expenses.
Next project